There’s a cliché metaphor that is is commonly used to explain the natures and relationship between reliabilty and validity. I think there there is more to be learned through this metaphor than is presented.
The Cliché
The metaphor used is a target. I have seen archery, darts and javelins. But I am not a good enough artist to show those. However, I did make a target and set of images to develop the metaphor further. (Notice the depth and texture I made? Notice how the light comes from the upper left? I did that. Intentionally. I’m so proud of myself!)

An Empty Target.
The cliché explanation points out that reliability is the consistency with which one hits the target and validity is how on target one is. So, in Figure 1, we see low reliability and low validity. That is low reliability because the hits are not consistent. Were they clustered together, they would be consistent, and consistency is really the technical statistical (and psychometric) meaning of reliability. Figure 2 also shows low validity, because the hits are not really on target, in that they are not near the bullseye. But in Figure 2, the hits are clustered, so they are reliable. That consistency is reliability.

Figure 1: Low reliability and low validity.

Figure 2. High reliability, but low validity

Figure 3: High reliability and high validity.
Figure 3 shows the dream — high reliability and high validity. Tightly clustered and clustered exactly where we would want them to be clustered. As the Kool-Aid Man would say, “Oh, yeah!”
The Optional Addition
Sometimes, the explanation includes a Figure 4.

Figure 4. Medium reliability and medium validity?
Figure 4 shows that there is a middle ground between Figure 1 and Figure 3. That one can have middling reliability and validity. The problem with this, when it is included it is presented as tradeoff with Figure 2. That is, the gains in validity (i.e., closer to the bullseye) are offset by the losses in reliability (i.e., less tightly clustered). But I don’t buy that. I think that the gains in validity are clearly and obviously well worth the losses in reliability. Methinks that the difficulty of suggesting that Figure 4 does not present a vastly superior outcome to Figure 2 is why is is often excluded. (This comes from an agenda that I will explore next week.)

Figure 4b. Not quite as good.

Figure 4c. High reliability and medium validity.
Certainly, Figure 4 is better than Figure 4b. The latter figures shows hits that simply are not as close to the bullseye, even though they are exactly as scattered as the former figure. I understand the claim that perhaps the hits in Figure 4c show equal reliability/validity tradeoffs with Figure 4b. But both seem clearly inferior to Figure 4, to me. (Again, an agenda to explore next week.)
Extending the Metaphor
I think that we can extend the metaphor for two more lessons.
First, I think that the differences between Figure 4 (it’s the same Figure 4 shown above) and Figure 5 are the most important differences in this whole metaphor. In reality, we simply cannot expect perfect reliability. Not even Figure 2 was perfect. It reality, it is just as question of how much better we can make the reliability. In reality, small differences are what we can achieve, where we can improve, almost all of the time.

Figure 4.
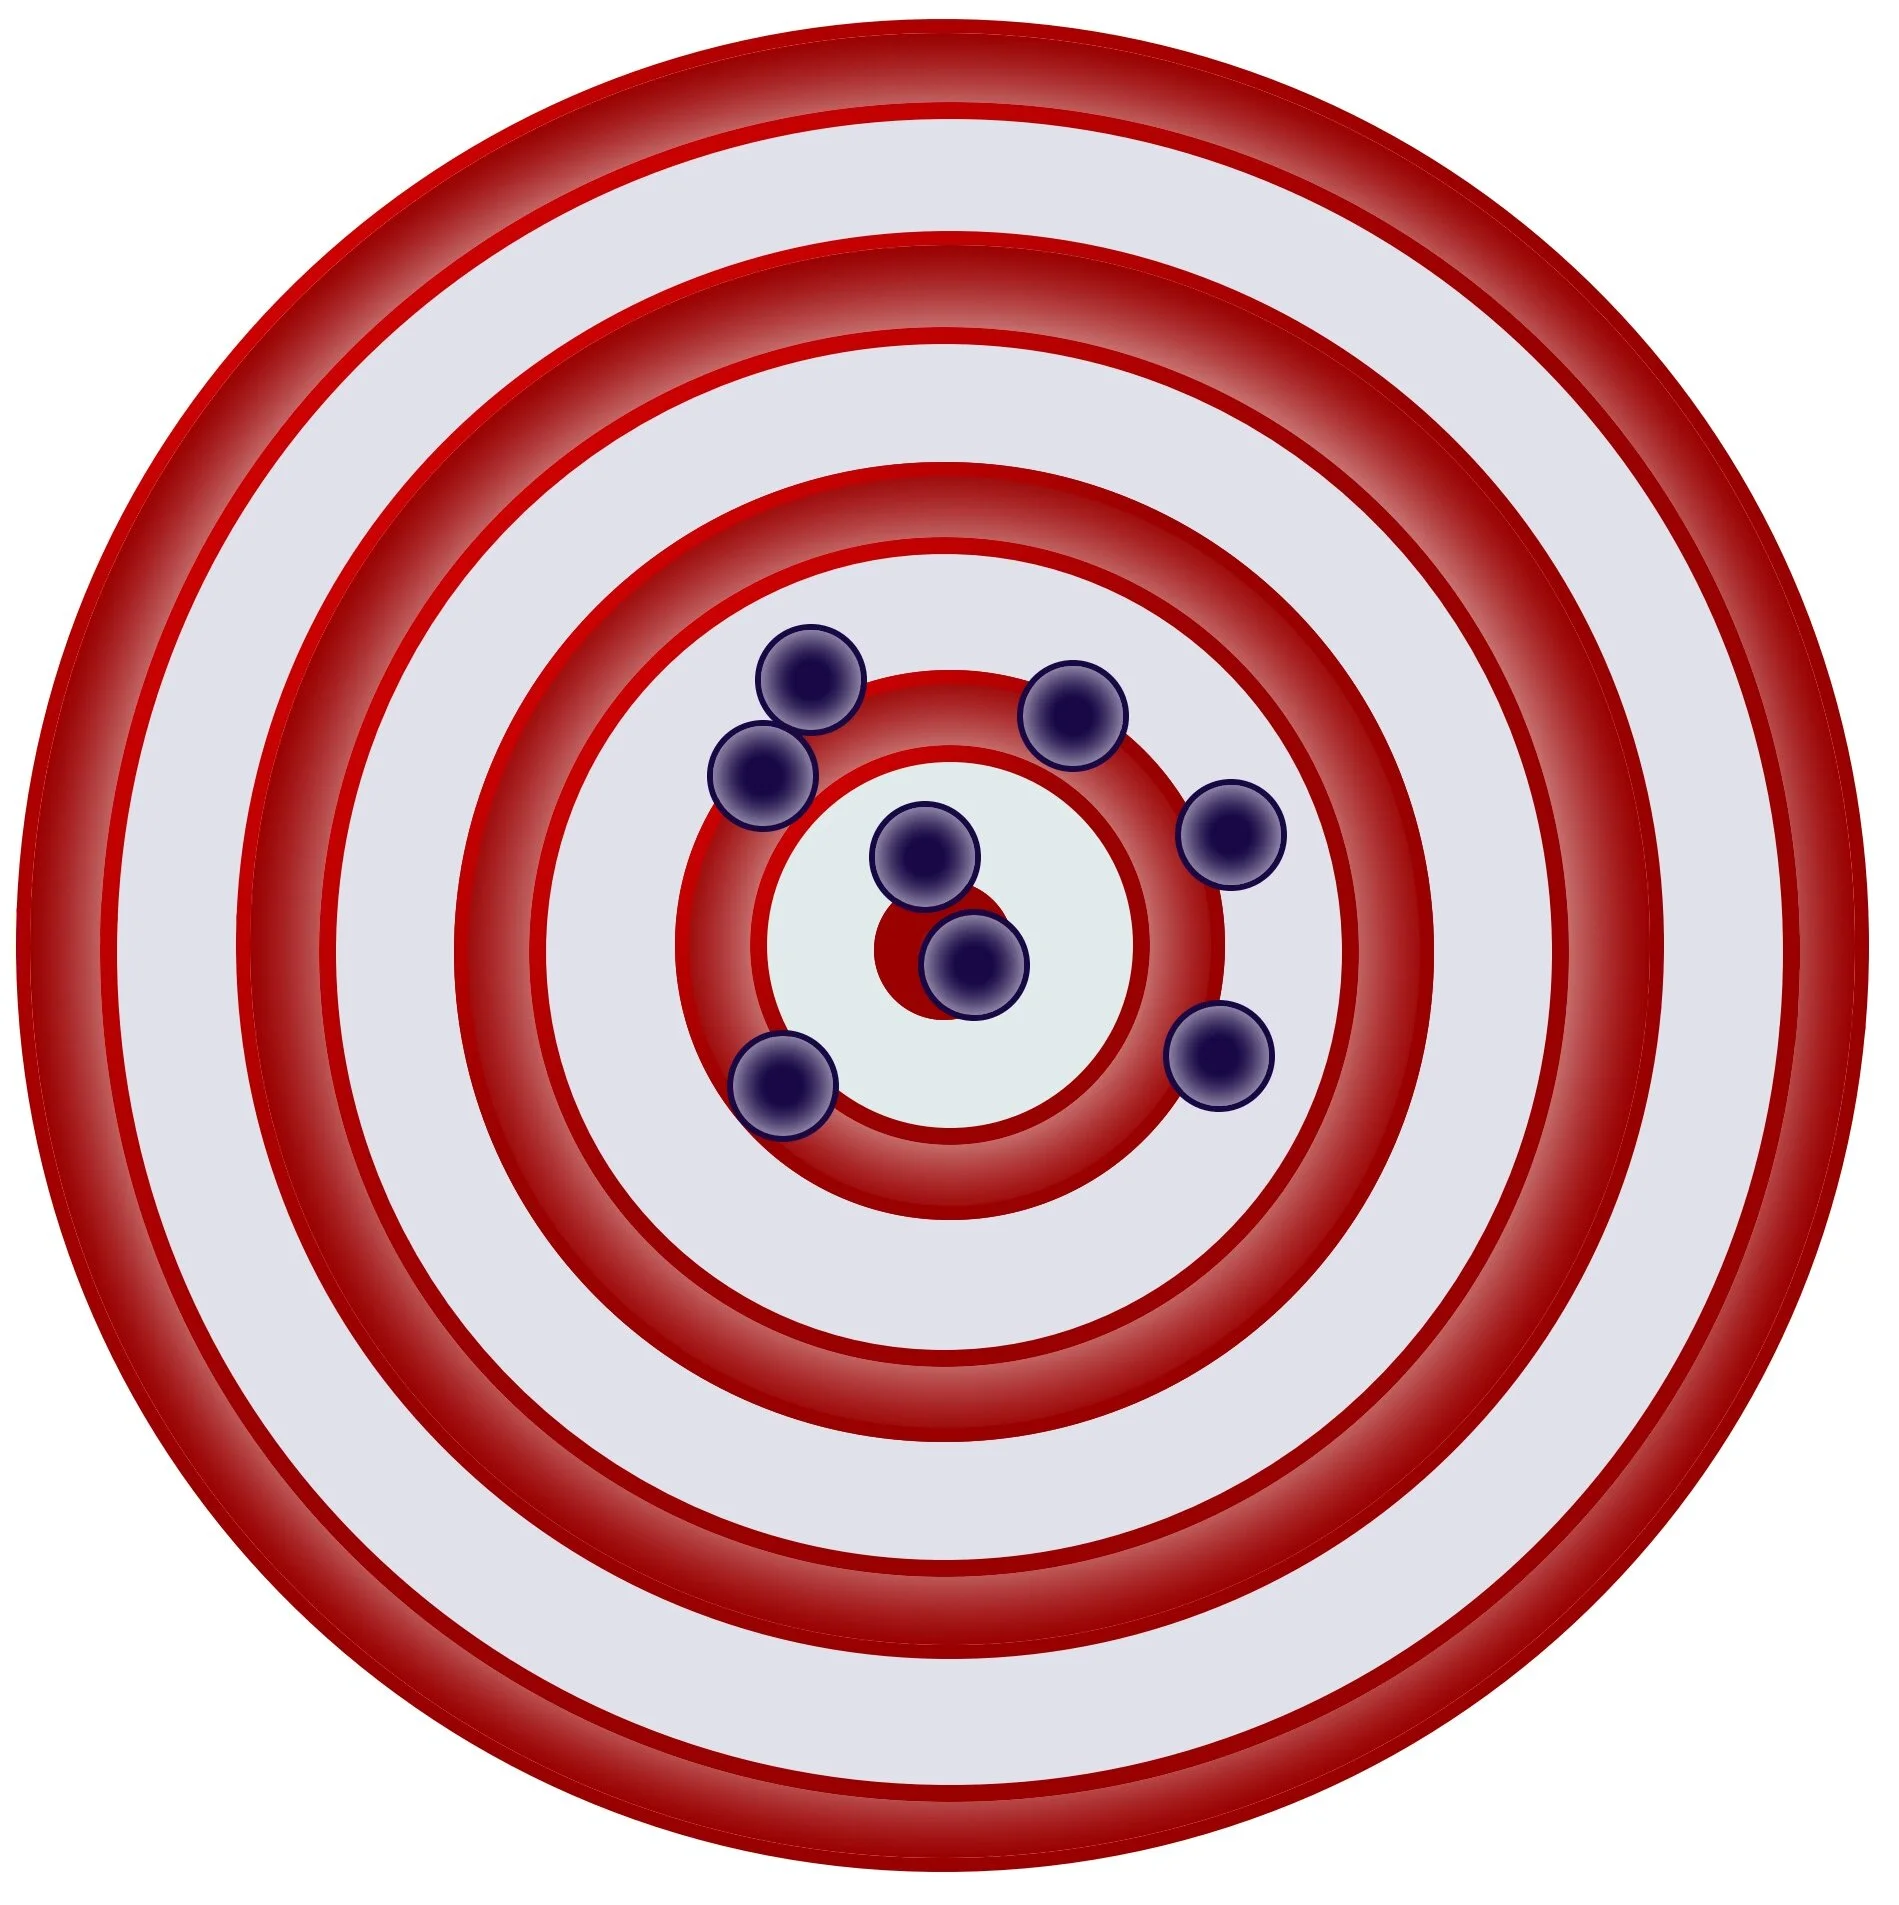
Figure 5
Incremental progress is progress, after all. And, in reality, almost all progress that has any chance of sticking is incremental progress. So, if you can go from kinda medium to a little bit bette than kinda medium? Take the win!
Last, there is one final lesson we can take in this metaphor. Figure 8 shows the statistical view of reliability and validity. it shows the psychometric view.

Figure 6. The Psychometric View
No, there is no target in the psychometric view. Because we cannot quantify validity, statistics have almost nothing to say about validity. They do not even see a target. But damn aren’t those hits tightly clustered!